Multimodal Weed infestation rate Prediction System (MWPS)
Introduction
The Multimodal Weed Infestation Rate Prediction System (MWPS) is a system proposed in the paper "RGB and infrared images cross-fusing support multimodal weed infestation rate prediction system" to improve the prediction accuracy of weed infestation rates. The MWPS framework aims to address the challenges of multimodal image modal differences and image feature mismatches in weed infestation rate prediction. It leverages generative adversarial learning, self-attention mechanisms, and unsupervised image alignment techniques to achieve efficient fusion of useful features and improve the model's prediction accuracy in complex scenes.The proposed MWPS framework has been validated through extensive experiments and shown to be efficient and real-time in predicting weed infestation rates in the field. It provides a solution for accurately quantifying weed infestation rates, which is crucial for determining the dosage of herbicides and avoiding environmental pollution caused by excessive chemical use.In conclusion, MWPS is a comprehensive and effective system that integrates image transformation, multimodal fusion, and prediction modules to improve the matching of multimodal information, select effective features, and predict weed infestation rates quickly and accurately.
Dependencies
- CUDA 10.1
- Python 3.6 (or later)
- Pytorch 1.6.0
- Torchvision 0.7.0
- OpenCV 3.4
- Kornia 0.5.11
Data
To obtain remote field weed data, we collected an early pepper weeds multimodal database (PWMD), we adopt a UAV device equipped with visible and infrared cameras to collect data sets at different times during certain days in early summer 2022. Our experimental field was planted with pepper varieties at the seedling stage and was located at longitude: 107.044 and dimension: 27.737. During the acquisition of infrared images (1280×960) and RGB images (4608×3456), the UAV flew at an altitude of between 10 and 15 meters, resulting in a total of 157 raw images. In addition, we also performed operations on the image data to eliminate blurred images, duplicate images, and anomalous images and finally cut the images into 256×256 sizes, which resulted in a total of 1,495 pairs of infrared images and visible light images. To make a fair comparison, our comparison experiments use the same training set and test set, and the training set and test set are divided by the randomization method in the ratio of 8:2.
The code can be downloaded from there. All datasets can be download from there.
Pre-trained models
Pre-trained model files are uploaded. You can download it.
Get start
Image transformation
cd ./Image_tanse
python train.py --dataroot ./trandata --name train_model --model cycle_gan --dataset_mode unaligned
cd ./Image_transe
python test.py --dataroot ./testdata --name train_model_pretrained --model test --no_dropout --preprocess non
Multimodal image fusion
cd ./Fusion
python train.py
cd ./Fusion
python test.py
Predict
cd ./predict
python train.py
Results
Comparison of NDVI and segmentation methods
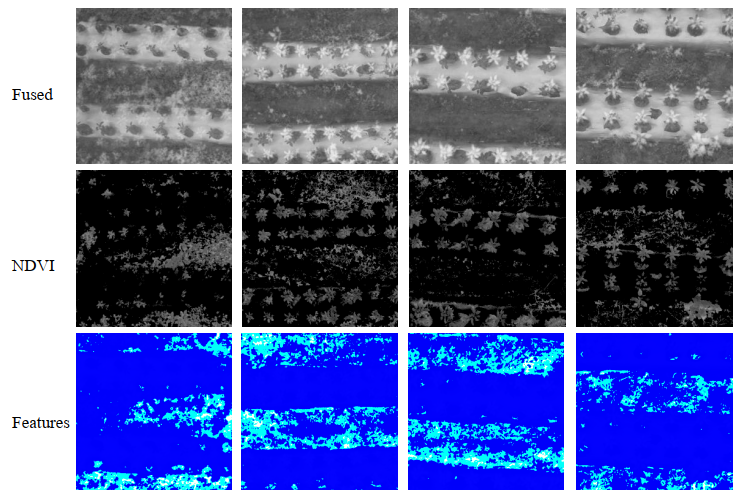
Figure 1: Visualization of the final results of the counting statistics layer in the WIRP, representing the weed characteristics of interest to the model.
The visualization results show that our model does focus on field weed features, which further validates that our approach can learn general properties of data and identify features efficiently.
Table 1: Comparison results between unsupervised generative adversarial models and gradient computation operators for three metrics in the modal transformer.
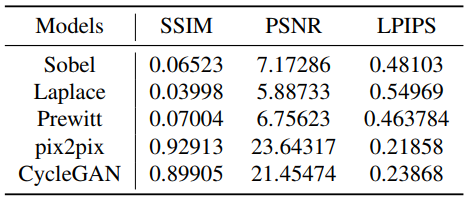
The three metrics of generative adversarial learning are much better than the traditional gradient learning operator, which indicates that the gradient learning operator loses a lot of information in the process of conversion. Moreover, we find that the Pix2pix method slightly outperforms CycleGAN on SSIM and PSNR metrics, illustrated that pix2pix focuses on pixel-level similarity differentiation, while PSNR also compares pixel by pixel. In addition, cycle's method realizes the best on LPIPS because LPIPS is a perceptual measure that is more in line with the human eye's visualization.
Histogram comparison of NDVI
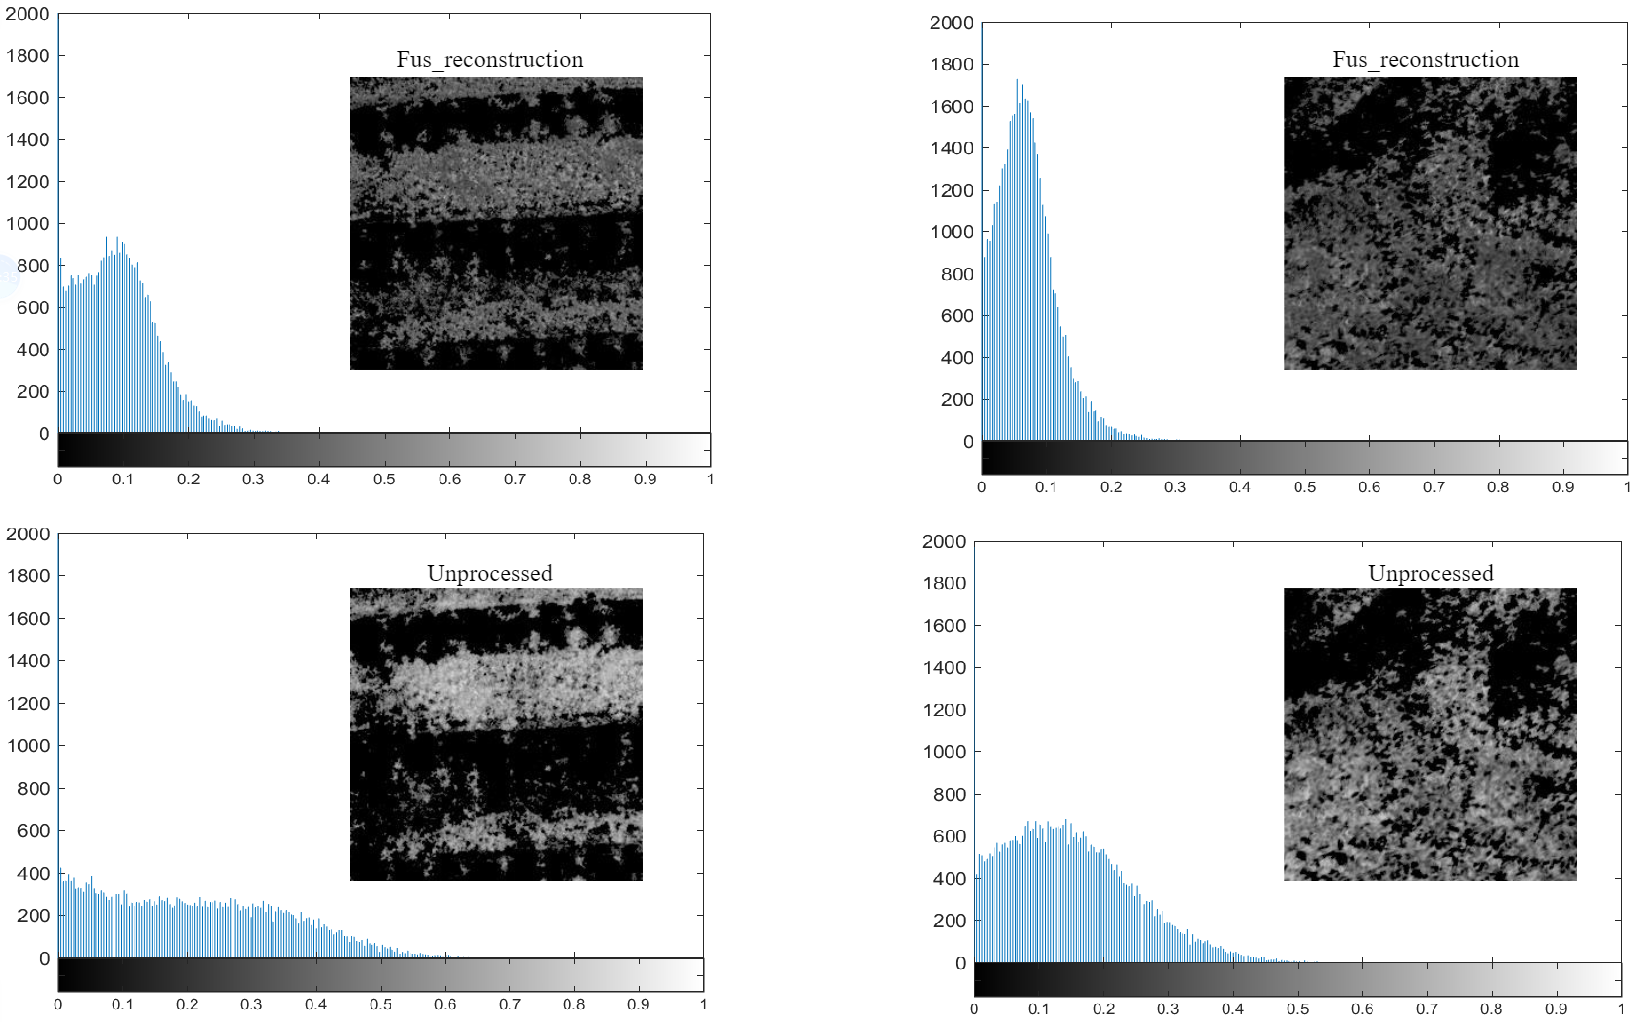
Figure 2: Comparison of fusion reconstruction results with histograms of source RGB maps processed by NDVI.
Since our original dataset has fewer plant species, the histograms of high-quality images should be highly concentrated, reflecting the abundance of such plants. Moreover, the distribution of the histogram is relatively narrow, the range of variation of NDVI values for the same plant species will not be large. We can observe that the general trend of the data is the same for both results, but the unprocessed data is more dispersed and even less reflective. The vegetation signal after image alignment and fusion with the IR image is further increased and enhanced. The reflectance peaks are larger and the data distribution is more concentrated and therefore more favorable for downstream tasks.
Comparison of Discrepancy Features Aggregator
Table 2: Comparison results of our proposed method with existing unsupervised infrared and visible image fusion methods in terms of fused image structure, visual effect, information content, and other metrics.
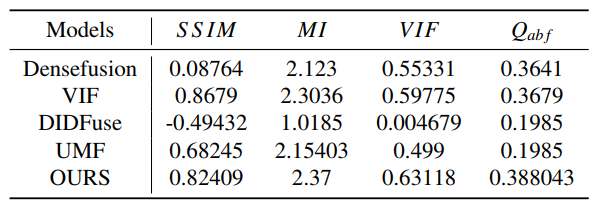
In both MI and VIF, our proposed method shows the best result, which indicates that our fused images contain the most information and have the best visualization. It can be seen that the DenseFuse and DIDFuse do not perform well on MI and VIF, which proves that the unimodal encoder cannot handle the modal differences of multimodal data well, thus proving the effectiveness of our modal-cross converter(McC). In addition, Qabf can reflect the quality of the blurred image, and our method is still the best on this metric, which shows that it is useful to adopt the Laplace operator to enhance the feature signal in our DFA.
Hyperparameter Selection
Table 3: Ablation results for hypercorrelation.
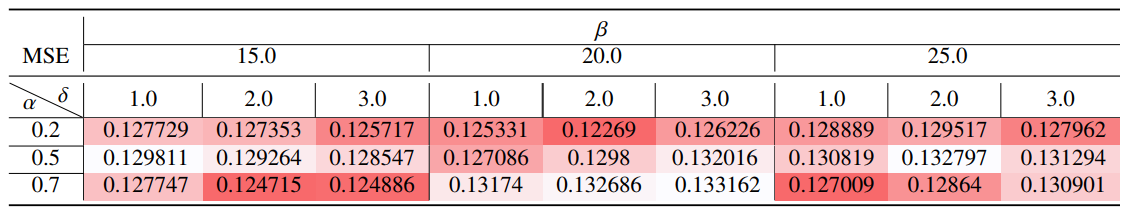
Table 3 shows the test results of the MSE metric in WIRP for the 27 data sets. Using the β metric as a guide, the darker the color of the data in the nine-panel grid indicates that the current super-parameter combination performs better under MSE. We observe that when β takes a large value, both α and δ take a worse effect. And we can find that the smaller the value of α is, the better the final prediction result is. We analyze this because α represents the influence of the reverse deformation of the feature alignment on the deformation field prediction, and the larger the value of α is, the more the overall deformation field is not affected by the current positive acquisition features. While β is too large, it will lead to difficulty in focusing on the image texture details during image fusion, which are not favorable to our subsequent tasks.